 |
|
|
|
User Guide: Tool DescriptionIPNetMonitor provides ten integrated Internet tools:
|
|||||||||||||||||||||||||||||||||||||||||||||||||||||||||||||||||||||||||||||||||||||||||||||||||||||||||||||||||||||||||||||||||||||||||
|
|
Type the IP address of the host you want to test and press Return. If you have access to a Domain Name Server (DNS), you can type a DNS host name like "www.apple.com" in the name field and press Return. To lookup a name or address, type the name or address in the corresponding field and press Lookup (the small magnifying glass next to the name field). Network connections are tested by sending an echo request packet and waiting to receive an echo response (ICMP echo test, often called "ping"). A green check mark indicates the corresponding echo datagram was sent or received. A red "X" indicates there was no response within the timeout interval. An orange "X" indicates a "Destination unreachable" response was received. The Log Window may provide more information. "Limit" specifies the number packets to send for this test. If Limit is zero or blank, the test will continue indefinitely. "Delay" specifies the delay in seconds between sending packets. |
If you have Internet Config installed, you can make IPNetMonitor a helper application for URLs of the form <ping://www.sustworks.com/> or <ping:199.232.56.35/0/60> (where the last two numbers specify the Limit and Delay if present). You can test a range of IP addresses by entering two addresses separated by a hyphen. <ping:10.0.0.0-10.0.0.15> for example. The results of each test are recorded in the Log Window.
When you invoke one window from another, the corresponding data is automatically transferred. Invoke the Trace Route window from the Window menu (Cmd-R) to begin a Trace Route to this same IP Address. Invoke the Subnet Calculator (Cmd-B) to transfer the IP Address to the Subnet Calculator.
Keyboard Shortcuts
|
Cmd-Period |
Abort a test or lookup in progress |
|
Cmd-T |
Open another Test Connectivity window |
|
Cmd-R |
Trace Route to this same address |
|
Cmd-B |
Transfer address to Subnet Calculator |
|
Cmd-D |
Begin Address Scan |
|
Cmd-1 |
Launch telnet GURL to this same address |
|
Cmd-2 |
Launch HTTP GURL to this same address |
|
Tab |
Move between fields |
|
Cmd-U |
Lookup |
Trace Route
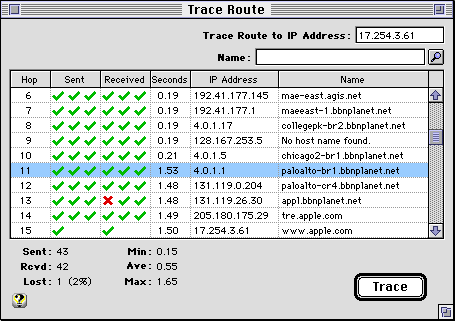
Type the IP Address of the destination you want to trace and press Return. If you have access to a Domain Name Server (DNS), you can type a DNS host name like "www.apple.com" in the name field and press Return. To lookup a name or address, type the name or address in the corresponding field and press Lookup (the small magnifying glass next to the name field).
Network routes are traced by sending a packet with successively larger time to live (TTL) values in the IP header and recording any "time limit exceeded" messages that are returned. As each router forwards a packet, it decrements the TTL value and discards the packet reporting an error if TTL reaches zero. Each hop is tried three times and the average round trip time is displayed in seconds.
Normally a trace terminates when trace route receives a "Port unreachable" response from the target host. If trace route receives a "Destination unreachable" response that is not "Port unreachable" from the target host, trace route will show an orange "X" in the Received column, show the reason the packet could not be forwarded in the Name column, and terminate the trace.
When a "time limit exceeded" message is received, trace route uses the source address of this message to lookup the corresponding Name. The trace continues while any lookup is in progress as indicated by the word "Looking..." in the Name column. The IP Address and Name for this hop are remembered, so a DNS lookup will not be necessary on subsequent traces unless the IP Address changes.
Additional Features
You can double-click on any destination in the table to start a Ping test to that address. You don't have to wait for the trace to finish.
When you invoke one window from another, the corresponding data is automatically transferred. Select any destination in the table and invoke the "Who Is" window from the Window menu (Cmd-I) to look up "Who Is" responsible for the corresponding 2nd level network domain. Invoke the Subnet Calculator window (Cmd-B) to transfer the IP address to the Subnet Calculator.
If you have Internet Config installed, you can make IPNetMonitor a helper application for URLs of the form <traceroute://www.sustworks.com/> or <traceroute: 199.232.56.35>.
You can invoke Telnet to the corresponding destination by launching a <telnet://...> GURL via Internet Config. Use Cmd-1 from the Ping or Trace Route window. [Works great with Nifty Telnet.]
You can select the results of a Trace Route test and copy them to the clipboard as plain text (for pasting into email messages). If you include the first row of the table in your selection, the table headings will also be copied as shown here.
 <traceroute: 17.254.3.28>
 Hop Sent Rec'd Seconds IP Address       Name
  1  YYY  YYY    0.15   146.115.101.227  dial-13.mbo.ma.ultra.net
  2  YYY  YYY    0.15   146.115.12.67    un-gw-3.mbo.ma.ultra.net
  3  YYY  YYY    0.16   199.232.56.71    infra-w-4.mbo.ma.ultra.net
  4  YYY  YYY    0.24   206.185.153.37   agis-ultra.boston.agis.net
  5  YYY  YYY    0.21   206.185.153.238  a0.731.washington2.agis.net
  6  YYY  YYY    0.18   192.41.177.145   mae-east.agis.net
  7  YYY  YYY    0.28   192.41.177.1     maeeast-1.bbnplanet.net
  8  YYY  NYY    0.24   4.0.1.17         collegepk-br2.bbnplanet.net
  9  YYY  YYN    0.21   128.167.253.5    No host name found.
 10  YYY  YYY    0.25   4.0.1.5          chicago2-br1.bbnplanet.net
 11  YYY  YYY    1.03   4.0.1.1          paloalto-br1.bbnplanet.net
 12  YYY  YYY    1.03   131.119.0.204    paloalto-cr4.bbnplanet.net
 13  YYY  YYY    0.98   131.119.26.30    appl.bbnplanet.net
 14  YYY  YYY    1.56   205.180.175.30   ton.apple.com
 15  Y    Y      1.06   17.254.3.28      www.apple.com
The first line is the URL for this trace. If you use Internet Config and have selected IPNetMonitor as the corresponding helper application, you can rerun the trace by command clicking on the first line. [Great if someone sends you email including the results of a Trace Route, and you want to reproduce it.]
Keyboard Shortcuts
|
Cmd-Period |
Abort a test or lookup in progress |
|
Cmd-R |
Open another Trace Route window |
|
Cmd-T |
Test Connectivity to selected destination |
|
Cmd-I |
Who Is 2nd level domain of selected destination |
|
Cmd-B |
Transfer selected destination to Subnet Calculator |
|
Cmd-D |
Begin Address Scan |
|
Cmd-1 |
Launch telnet GURL to selected destination |
|
Cmd-2 |
Launch HTTP GURL to selected destination |
|
Tab |
Move between fields |
|
Cmd-U |
Lookup |
Name Server Lookup
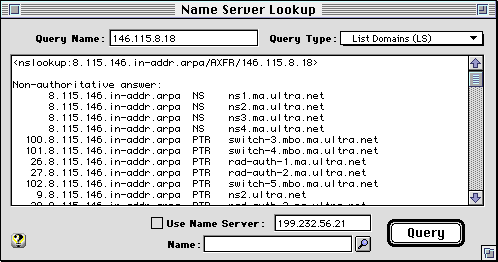
NSLookup allows you to retrieve additional information from the Internet Domain Name System by sending querries to your default Name Server, or an alternate Name Server you specify. Enter the domain name in the "Query Name" field, and select the type of query using the "Query Type" popup menu.
To convert between an IP address and a domain name, you can also use the IP Address and Name fields with the lookup button (small magnifying glass) in many of the IPNetMonitor windows. This will use the domain name system recursively (by calling the local Resolver) to find the corresponding name or address. NSLookup querries the default or specified Name Server directly, and may not return an answer if the Name Server does not have the information requested and does not support recursion to automatically pass the query to the next authoritative Name Server.
If you enter an email address of the form <username>@<host>, NSLookup will convert it to <username>.<host> per domain name convention. If you enter a dotted quad IP address of the form <AA.BB.CC.DD>, NSLookup will convert it to <DD.CC.BB.AA>.IN-ADDR.ARPA per domain name convention. To lookup the host name for an IP address, enter the IP address as a dotted quad and select "Pointer" as the query type.
To find the domain names registered to an organization, first lookup the name servers for that organization (for example, lookup "apple.com" with query type Name Server), then copy the IP address of a name server to the "Query Name" field and select query type List Domains (uses Start of Authority followed by a Zone Transfer).
Name Servers respond to querries with zero or more matching resource records. For each record received, NS Lookup will show the resource name, resource type, Time To Live (TTL), and any resource data based on the type of record received. A response may also include additional records specifying authoritative Name Servers for the requested domain, and the IP address of the name server (intended to reduce the need for additional lookups).
Using NSLookup, WhoIs, and Finger, you can often determine the original source of unsolicited email containing forged headers (SPAM) and request the parties involved to take appropriate corrective action. See <http://www-fofa.concordia.ca/spam/> for more information.
If you have Internet Config installed, you can make IPNetMonitor a helper application for URLs of the form <nslookup:ultranet.com/NS> (lookup name servers for "ultranet.com") or <nslookup:www.sustworks.com/CNAME/ns2.ma.ultra.net> (lookup canonical name for "www.sustworks.com" from name server ns2.ma.ultra.net).
When you invoke one window from another, the corresponding data is automatically transferred. Invoke the Test Connectivity window from the Window menu (Cmd-T) to begin a ping test to the Name Server address.
Keyboard Shortcuts
|
Cmd-Period |
Abort a test or lookup in progress |
|
Cmd-L |
Open another NSLookup window |
|
Cmd-T |
Test Connectivity to Name Server |
|
Cmd-R |
Trace Route to Name Server |
|
Cmd-B |
Transfer Name Server address to Subnet Calculator |
|
Cmd-D |
Begin Address Scan |
|
Tab |
Move between fields |
|
Cmd-U |
Lookup |
|
Cmd-up |
Previous in Query Type popup menu |
|
Cmd-down |
Next in Query Type popup menu |
Who Is
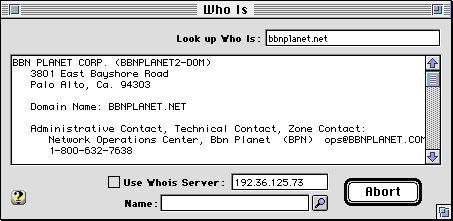
"Who Is" searches the InterNIC (Internet Network Information Center) Database of registered names allowing you to find the organization and administrative contact responsible for networks with registered domain names.
For example, if you discover a routing problem in accessing "www.sustworks.com", you can use "Who Is" to find out who is responsible for "sustworks.com". The information returned will normally include the email address of an administrative contact to be notified in case of connectivity problems.
From the Trace Route Window, select any destination in the table and press Cmd-I to look up "Who Is" responsible for the corresponding 2nd level network domain.
Many international domain names (outside the United States) are not registered by the InterNIC. If a Whois query does not find a matching database entry, you may need to specify an alternate Whois Server by selecting the "Use Whois Server" checkbox and entering the appropriate server address or name. Often, you can find the appropriate Whois Server by entering a Whois query for the top level domain. For example, to lookup who is "liu.se", you would first lookup who is "SE-DOM" (the top level "se" domain). The information returned will usually include one or more references to the domain name of the organization that administers that domain. In our example, this would be "sunet.se" and doing a name server lookup on "whois.sunet.se" returns the address of the appropriate Whois Server.
Whois can be used to search for other information as well. Most Whois servers will provide further instructions if you send an empty Whois query.
If you close the Who Is window with an alternate server address specified, the server address will be saved and restored the next time you open the Who Is window.
If you have Internet Config installed, you can make IPNetMonitor a helper application for URLs of the form <whois://sustworks.com>.
When you invoke one window from another, the corresponding data is automatically transferred. Invoke the Test Connectivity window from the Window menu (Cmd-T) to begin a ping test to the Whois Server address.
Keyboard Shortcuts
|
Cmd-Period |
Abort a test or lookup in progress |
|
Cmd-I |
Open another Who Is window |
|
Cmd-T |
Test Connectivity to Whois Server |
|
Cmd-R |
Trace Route to Whois Server |
|
Cmd-B |
Transfer Whois Server address to Subnet Calculator |
|
Tab |
Move between fields |
|
Cmd-U |
Lookup |
Finger
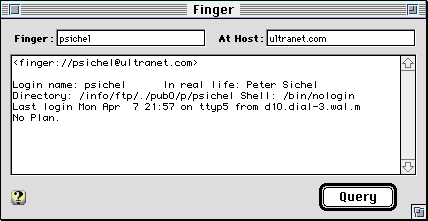
Finger is a simple Internet query and response protocol. The Finger Client (IPNetMonitor) sends a text string identifying the information it wants to a Host, and then displays the response (if any).
On traditional time-sharing systems like UNIX, sending the account or username in a Finger query will return information about that user and whether they are currently logged in. This is known as "fingering someone".
A simple way to use Finger is to enter the email address (username@host) of the person you want to finger and press return to request information about that user. Sending an empty finger request by specifying the "At Host:" field and leaving the "Finger:" field empty will often return a list of users currently logged in to that host.
Notice the Finger Server identifies the information or action being requested by the text string it receives in the Finger query. Thus Finger can have many creative uses depending on how the Finger Server is setup to respond.
If you have Internet Config installed, you can make IPNetMonitor a helper application for URLs of the form <finger://psichel@ultranet.com> or <finger:psichel@ultranet.com>.
Keyboard Shortcuts
|
Cmd-Period |
Abort a test or lookup in progress |
|
Cmd-F |
Open another Finger window |
|
Cmd-T |
Test Connectivity to Finger Server |
|
Cmd-R |
Trace Route to Finger Server |
Monitor
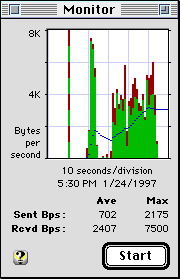
The Monitor window allows you to see the characters per second throughput of your Internet connection in real time. Green bars along the bottom show receive data and red bars above them indicate transmit. A blue line shows a 10 second running average.
The graph shifts left each second to show the last minute of transmit and receive data. Any interruption in the reported data is indicated by a bar of alternating green and red stripes the full height of the graph.
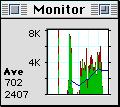
You can reduce the size of the Monitor display by clicking in the zoom box to toggle between the full size display and a small display that uses less screen space. The small display is designed to be left on all the time. Notice you can cover all but the right most edge of the small Monitor window and still see the graphic display and average throughput.
The number of characters per second are counted at "interrupt time", so are largely unaffected by other applications on your system. The graph however is updated at application or "SystemTask" time, so may appear to stall if another application holds the processor for an extended period. When the application yields, any previously collected data for up to 30 seconds will be displayed. If the Monitor window is not allowed to update for more than 30 seconds, additional data will be discarded and an alternating green and red bar will appear to indicate a disruption. The average bytes per second will also be reset to include only the new data.
The Monitor actually collects data by inserting a probe module immediately above the Data Link provider layer. If no Streams are open to your data link provider, the button may read "Pending" to indicate there is nothing to monitor. The display will start again when the data link layer is opened.
For monitoring to work, the probe module must be inserted before the first network connection is opened. The probe module is called "OTModl$Proxy" and must be placed in your Extensions Folder. You can insert the module by opening the Monitor window before starting any other network applications, or placing a copy of the supplied "SetupAP" application in your Startup Items folder. SetupAP simply tells Open Transport to "autopush" the STREAMS module "OTModl$Proxy" above any PPP device it finds and then quits.
For Monitoring other data link providers (such as Ethernet), you will be prompted to confirm whether you wish to modify your TCP/IP configuration. This technique may change in future versions.
While monitoring is active, IPNetMonitor will record incoming ICMP Echo Requests (pings) in the Log Window.
TCP Info
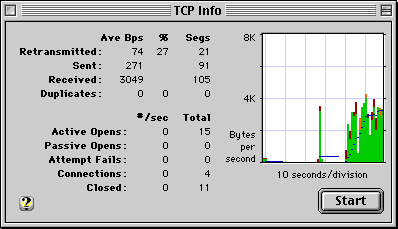
The TCP info window allows you to examine TCP/IP data transfer and connection state more closely.
The plot on the right side of the window is similar to the IP Monitor but only shows TCP data (no TCP or IP headers, and no UDP or ICMP datagrams). Green bars along the bottom show receive while red bars above them show transmit data if any. Yellow at the bottom of the receive bar indicates duplicate receive data, while orange at the top of the transmit bar indicates retransmitted data.
The window also includes counters that report the following:
Average bytes per second retransmitted (10 second running average).
Average bytes per second sent.
Average bytes per second received.
Average duplicate bytes per second received.
The number of segments retransmitted.
The number of segments sent.
The number of segments received.
The number of duplicate segments received.
The number of TCP connections currently established.
The number of TCP connections opened (active open).
The number of TCP connections accepted (passive open).
The number of TCP connections closed.
The number of attempted TCP connections that failed (could not be established).
Connection List
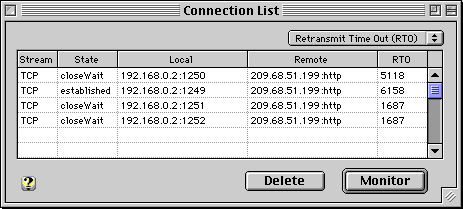
The Connection List window allows you to see information about your current TCP/IP connections. Press "Monitor" to display and update the connection list table once each second. Press "Pause" to stop updating the table for easy viewing or further analysis.
Use the popup menu to select an additional TCP connection parameter you wish to monitor.
To terminate a connection immediately, select a row in the table and press "Delete".
Additional Features
You can double-click on any connection in the table to start a Ping test to the corresponding remote address.
When you invoke one window from another, the corresponding data is automatically transferred. Select any destination in the table and invoke the "Trace Route" window from the Window menu (Cmd-R) to begin a Trace Route to the remote address.
You can select rows from the connection list and copy them to the clipboard as plain text (for pasting into email messages). If you include the first row of the table in your selection, the table headings will also be copied.
Well known protocol port names are stored as 'STR ' resources starting from offset 10000. 'STR ' 10007 = "echo" and 'STR ' 10020 = "ftp-data" for example.
Keyboard Shortcuts
|
Cmd-Period |
Pause updating Connection List table |
|
Cmd-R |
Trace Route to selected destination |
|
Cmd-T |
Test Connectivity to selected destination |
|
Cmd-B |
Transfer selected destination to Subnet Calculator |
|
Cmd-D |
Begin Address Scan |
|
Cmd-1 |
Launch telnet GURL to selected destination |
|
Cmd-2 |
Launch HTTP GURL to selected destination |
Address Scan
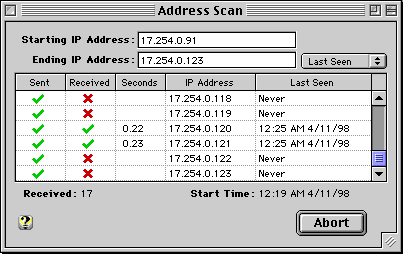
The Address Scan window allows you to scan a range of IP Addresses to check for available hosts and assigned domain names.
Enter the starting and ending IP Address in the corresponding fields and press Scan to begin scanning. For each address in the specified range, the Address Scan window will ping that address to see if the corresponding host is available and perform a Domain Name Server lookup to find the registered domain name for that address if any. Alternatively, the Address Scan tool can repeat the scan every minute to report the last time a host was seen (select "Last Seen" in the popup menu).
If you leave the ending address empty, a default range of 32 addresses is used. You can also specify an address range by separating two IP Addresses by a hyphen "-" in the starting address field. The maximum scan range is limited to 1024 addresses for efficiency. To retrieve a larger range of domain names, you can request a Zone Transfer using the NSLookup window (recommended).
Additional Features
You can double-click on any destination in the table to start a Ping test to that address. You don't have to wait for the scan to finish.
When you invoke one window from another, the corresponding data is automatically transferred. Select any destination in the table and invoke the "Who Is" window from the Window menu (Cmd-I) to look up "Who Is" responsible for the corresponding 2nd level network domain. Invoke the Subnet Calculator window (Cmd-B) to transfer the IP address to the Subnet Calculator.
If you have Internet Config installed, you can make IPNetMonitor a helper application for URLs of the form <scan://199.232.56.13> or <scan:199.232.56.13-199.232.56.20>.
You can select the results of an Address Scan and copy them to the clipboard as plain text (for pasting into email messages). If you include the first row of the table in your selection, the table headings will also be copied as shown here.
 <scan: 199.232.56.35>
 Sent Received Seconds  IP Address       Name
The first line is the URL for this scan. If you use Internet Config and have selected IPNetMonitor as the corresponding helper application, you can rerun the scan by command clicking on the first line.
Keyboard Shortcuts
Cmd-Period
Abort scan in progress
Cmd-D
Open another Address Scan window
Cmd-T
Test Connectivity to selected destination
Cmd-R
Trace Route to selected destination
Cmd-I
Who Is 2nd level domain of selected destination
Cmd-B
Transfer selected destination to Subnet Calculator
Tab
Move between fields
Subnet Calculator
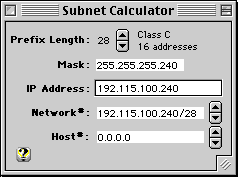
The Subnet Calculator makes it easier to specify IP addresses and masks for routing.
The Subnet Calculator converts prefix lengths into corresponding dotted quad net masks. The Prefix Length is adjusted by clicking on the up/down arrows and will update the Mask field accordingly.
The Subnet Calculator shows the traditional (classful) IP address class in the upper right based on the IP Address field. Press Return to specify the default non-subnetted mask for this class.
The Subnet Calculator shows the Network# and Host# portion of an IP address based on the Prefix Length. The network and host portion of the IP Address can be adjusted separately by clicking on the corresponding arrows. Once the correct values are shown, they can be dragged or copied to other input fields as needed.
The Subnet Calculator can determine the CIDR aggregates for a range of IP addresses or classful networks. Two IP addresses separated by a hyphen form an IP address range (example: 192.111.4.0-192.111.15.0). After entering an address range, the Network# field will display the corresponding networks using CIDR aggregate notation (network prefix/length). Pressing the up/down arrows to the right of the Network# field will step through the CIDR aggregates needed to represent the corresponding network range. For example: network range 192.111.4.0-192.111.15.0 can be represented by CIDR aggregates 192.111.4.0/22 (4 class C networks) and 192.111.8.0/21 (8 class C networks).
The Subnet Calculator shows the host address range for a CIDR aggregate (network prefix/length). Entering "10.0/27" for example will show the Host# as address range 10.0.0.0-10.0.0.31. Notice the Host# address range ends with the subnet broadcast address (all 1's) even though this address should not be assigned to a host.
The Subnet Calculator determines the CIDR alignment based on the address class and right most 1-bit in the network prefix if an address ends in "/" with no length specified. Entering "146.111.96/" for example will show the Network# as 146.111.96.0/19.
When you invoke one window from another, the corresponding data
is automatically transferred. Invoke the Test Connectivity window
from the Window menu (Cmd-T) to begin a Ping test to the IP Address
shown. Invoke the Trace Route window (Cmd-R) to begin a Trace Route
to this IP Address.
Log Window
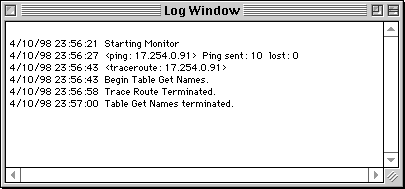
The Log Window records the operations performed and shows any errors encountered. You can select and copy parts of the log for future reference. If you ping a series of hosts, the log window records the results.

